Use the line graph to answer the question.The line graph shows the 2001 sales data for the Big "D" company. 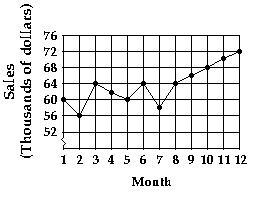 Which month had the lowest sales?
A. Month 3
B. Month 7
C. Month 2
D. Month 5
Answer: C
Mathematics
You might also like to view...
Write as a percent. 3
A. 150% B. 0.3% C. 0.03% D. 300%
Mathematics
Provide an appropriate response.A welder analyzed his account records and discovered that his profit could be predicted by the formula P = -x2 + 80x - 1500, where x represents the number of welds he could do daily. How many welds should he do daily to maximize his profits?
Fill in the blank(s) with the appropriate word(s).
Mathematics
Provide an appropriate response.A room is 18 ft by 20 ft. How many square feet of vinyl flooring are needed for the room?
A. 324 ft2 B. 76 ft2 C. 360 ft2 D. 720 ft2
Mathematics
Perform the indicated operation and simplify.2 ? 3
? 3
A. 6
B. 6
C. 
D. 6
Mathematics