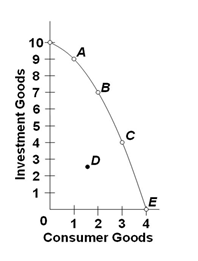
Refer to the graph below. The selection of which point on the production possibilities curve is most like to result in the largest increase in economic growth over time?
A. A
B. B
C. C
D. D
Answer: A
You might also like to view...
Use the following table to answer the question below.(1)(2)(3)(4)(5)QdQdPriceQsQs5040$1070806050960708060850609070740501008063040Suppose that market demand is represented by two demanders in columns (1) and (2) and market supply is represented by two suppliers in columns (4) and (5). If the price were artificially set at $6
A. demand would change from (2) to (1). B. a surplus of 50 units would occur. C. the market would clear. D. a shortage of 110 units would occur.
On the eve of World War I, gains for unions included all of the following except:
a. substantial wage gains for members in some industries, including bituminous coal mining. b. the establishment of insurance programs to compensate workers injured on the job. c. political victories, including the elevation of the Department of Labor to cabinet-level status. d. legal protection of the closed shop.
If a consumer reallocates his or her spending away from Good B and towards Good A, then the consumer's total utility will increase if:
A. MUA/PA > 0 and MUB/PB > 0. B. MUA/PA > MUB/PB. C. MUA/PA < 0 and MUB/PB < 0. D. MUA/PA < MUB/PB.
Refer to the information provided in Figure 2.4 below to answer the question(s) that follow.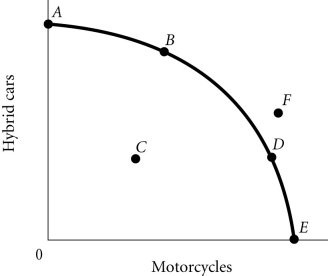 Figure 2.4According to Figure 2.4, as the economy moves from Point E to Point A, the opportunity cost of hybrid cars, measured in terms of motorcycles
A. increases. B. initially increases, then decreases. C. decreases. D. remains constant.