Solve the inequality graphically. Express the solution in set-builder notation. <
< 
A. { x <
x <  }
}
B. { x >
x >  }
}
C. { x <
x <  }
}
D. { x >
x >  }
}
Answer: A
You might also like to view...
Use order of operations to simplify the expression.(1 - 3) - 13
A. 11 B. 17 C. -9 D. -15
The spending (in billions of dollars) by Medicaid, the national health-care plan for the poor, over the 5-year period from 1988 to 1992 is summarized in the following table.
Year, x01234Expenditure, y1.5501.6621.7861.8882.009?
(Here,  represents the beginning of the year 1988.)Find an equation of the least-squares line for these data. Please round the coefficients in your equation to three decimal places. Use the
result of to estimate Medicaid spending in Massachusetts for the year 2007, assuming the trend continued.
represents the beginning of the year 1988.)Find an equation of the least-squares line for these data. Please round the coefficients in your equation to three decimal places. Use the
result of to estimate Medicaid spending in Massachusetts for the year 2007, assuming the trend continued.
A. 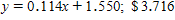 billion
B. 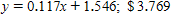 billion
C. 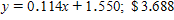 billion
D. 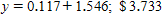 billion
Find the quotient and the remainder.-20x3 - 41x2 - 35x + 5 divided by 5x + 4
A. -4x2 - 5x - 3; remainder 17 B. -4x2 - 5x - 3; remainder 0 C. x2 - 3; remainder -5 D. -4x2 - 5x - 3; remainder 20
Factor.49 - z2
A. (7 - z)(7 + z) B. (7 + z)2 C. (z - 7)(z + 7) D. (7 - z)2