The graph below depicts a situation where, if the market demand for the product increases, the prices of the resources used by the firms in the industry would:
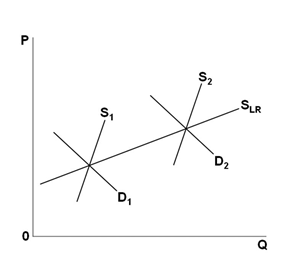
A. Increase
B. Decrease
C. Stay constant
D. Be set by the government
A. Increase
You might also like to view...
Tax revenues can rise as a result of a decrease in income tax rates, as long as the tax base increases sufficiently
Indicate whether the statement is true or false
Refer to the information provided in Figure 2.4 below to answer the question(s) that follow.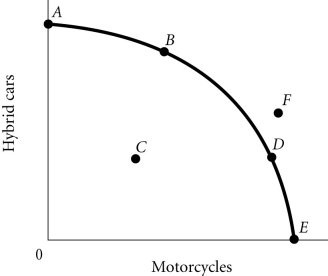 Figure 2.4Refer to Figure 2.4. The economy moves from Point E to Point B. This could be explained by
A. a change in society's preferences for hybrid cars versus motorcycles. B. an increase in economic growth. C. an increase in unemployment. D. a reduction in unemployment.
Which of the following factors causes the barter system to be inefficient?
A. Its cost of transaction is too low. B. It requires high liquidity. C. It requires a double coincidence of wants. D. The cost associated with information search is too low.
The notion that the annual rate of increase in the money supply should be equal to the potential annual growth rate of real GDP best describes the:
A. Monetary rule B. Velocity of money C. Equation of exchange D. Crowding-out effect