Refer to the information provided in Figure 8.8 below to answer the question(s) that follow. 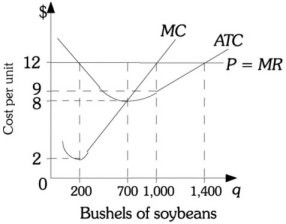 Figure 8.8 Refer to Figure 8.8. If the market price of soybeans falls to $8, then to maximize profits this farmer should produce
A. 200 bushels of soybeans.
B. 700 bushels of soybeans.
C. 1,000 bushels of soybeans.
D. a level of output that is indeterminate from this information.
Answer: B
You might also like to view...
Which of the following would cause a rightward shift of the supply curve for cell-phone services?
A. a decrease in price of cell-phones B. an increase in price of cell-phones C. a subsidy to cell-phone producers D. a tax on cell-phone producers
Suppose a tax on buyers has been imposed in the graph shown. The amount of deadweight loss generated by this tax is:
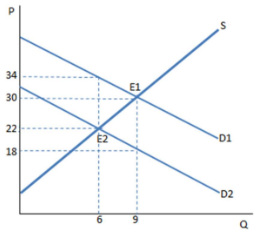
A. $0.
B. $18.
C. $36.
D. $72.
What would be the consequence of a 10 percent decrease in the price of a good for which price elasticity of demand is 5?
a. A 50 percent decrease in the quantity demanded b. A 5 percent increase in the quantity demanded c. A 50 percent increase in the quantity demanded d. A decrease in the quantity demanded by 0.2 units e. An increase in the quantity demanded by 0.2 units
Ceteris paribus, rising employment rates imply
A. Lower labor force participation rates. B. Higher labor force participation rates. C. Falling per capita GDP. D. Rising per capita GDP.