Solve.The following data represents the height (in inches) and weight (in pounds) of 9 randomly selected adults.  Graph the data on a scatter diagram treating height as the independent variable. Find an equation of the line containing the points (62, 126) and (70, 179). Express the relationship using function notation. Graph the line on the scatter diagram. Interpret the slope of the line. Use the line to predict the weight of a person who is 70.7 inches tall. Round to the nearest pound.
What will be an ideal response?

y = 6.625x - 284.75
W(h) = 6.625h - 284.75
If height is increased by one inch, then weight will increase by 6.625 pounds
184 lb
Mathematics
You might also like to view...
Choose the expression which is equivalent to the given expression.
A. sin 2° B. cos2 2° C. tan 2° D. sin2 2°
Mathematics
Solve.x4 - 49x2 + 180 = 0
A. ±3, ±3
B. ±2, ±3
C. ±2, ±
D. ±2, ±3
Mathematics
Use the quadratic formula to find the roots of the equation. Find a decimal approximation to the nearest thousandth.x2 + 5x - 5 = 0
A. x = -11.708, x = 1.708 B. x = 5.854 C. x = -5.854 D. x = -5.854, x = 0.854
Mathematics
If a triangle has vertices of 
 and
and  then the area of the triangle is given by
 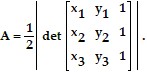 Find the area of the triangle with vertices at the given points.(1, -3) (1, 1) (4, 3)
A. 6 B. 2.5 C. 12 D. 5
Mathematics