The bar graph shows the number of new residents in several towns during the years 1999 to 2001. Use the graph to answer the question. 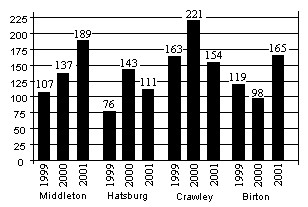 What was the total number of new residents in Hatsburg during the years 1999 to 2001?
A. 433
B. 330
C. 417
D. 321
Answer: B
You might also like to view...
Tell whether the statement is true or false. If false, give the reason.{54, 55, 54, 55} = {54, 55}
A. True B. False; the elements are not equal. C. False; the elements cannot be repeated. D. False; there must be the same number of elements.
Evaluate.-40
A. 1 B. -1 C. 0 D. -4
Evaluate.10!
A. 7,257,600 B. 3,628,800 C. 1,814,400 D. 362,880
Use Bayes' rule to find the indicated probability.The incidence of a certain disease on the island of Tukow is 4%. A new test has been developed to diagnose the disease. Using this test, 91% of those who have the disease test positive while 4% of those who do not have the disease test positive (false positive). If a person tests positive, what is the probability that he or she actually has the disease?
A. 0.438 B. 0.487 C. 0.91 D. 0.856