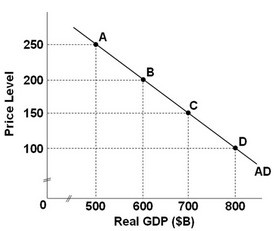
 Refer to the above graph, which shows an aggregate demand curve for a hypothetical economy. If the price level is 200, the quantity of real GDP demanded is:
A. $600 billion.
B. $700 billion.
C. $500 billion.
D. $800 billion.
Answer: A
You might also like to view...
An industry with a high concentration ratio might still be competitive if
A) there are no close substitutes for its product. B) its barriers to entry are low. C) its production is geographically concentrated. D) it has a high ratio of value added to sales.
Under oligopolistic market conditions,
a. the pricing actions of any one firm have no significant effect on the others. b. the pricing actions of any one firm have a significant effect on the others. c. no firm can have any control over its output price. d. all firms have identical prices for their products.
In a free-market system, producers will react to an increase in demand when
A. the price goes up. B. the government announces the increased demand. C. their costs increase. D. the free press publishes news of the increased demand.
A price-setting firm
A. can raise the price of its product and sell the same number of units. B. can lower the price of its product and sell more units. C. possesses little market power. D. sells a product that is not differentiated from the product sold by its rivals or sells in a limited geographic market area with only one or a few sellers.