Solve the problem.The one-day temperatures for 12 world cities along with their latitudes are shown in the table below. Make a scatter diagram for the data. Then find the line of best fit and graph it on the scatter diagram.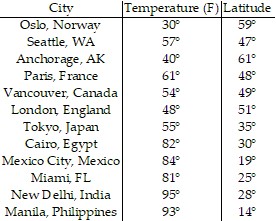 Latitude (degrees)
 Temperature (F)°
What will be an ideal response?
Latitude (degrees)
Temperature (F)°
Line of best fit = -0.68x + 82.91
You might also like to view...
Find the limit L for the given function f, the point x0, and the positive number ?. Then find a number ? > 0 such that, for all x,  f(x) =
  , x0 = -9, ? = 0.01
A. L = 0; ? = 0.01 B. L = -10; ? = 0.01 C. L = 8; ? = 0.02 D. L = -2; ? = 0.02
Use the shell method to find the volume of the solid generated by revolving the region bounded by the given curves and lines about the x-axis.y = 6x2, y = 6
A. 54?
B.  ?
?
C.  ?
?
D.  ?
?
Solve the problem.A woman deposits $129 in the bank, and each month afterward deposits 4% more than the month before. Find an expression for the amount she deposits on the nth month.
A. 129(1.4)n-1 B. 129(1.04) n-1 C. 129(1.04) n D. 129(1.04) n+1
Find the product and simplify. ?
? 
A. 
B. 
C. 
D. 