Use a graphing calculator to plot the data and find the quadratic function of best fit.The number of housing starts in one beachside community remained fairly level until 1992 and then began to increase. The following data shows the number of housing starts since 1992 (x = 1). Use a graphing calculator to plot a scatter diagram. What is the quadratic function of best fit?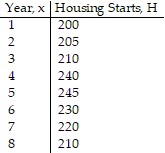
A. H(x) = -2.679x2 + 26.607x - 168.571
B. H(x) = -2.679x2 - 26.607x + 168.571
C. H(x) = -2.679x2 + 26.607x + 168.571
D. H(x) = 2.679x2 + 26.607x + 168.571
Answer: C
Mathematics
You might also like to view...
Find the present value of the annuity. Round to the nearest cent.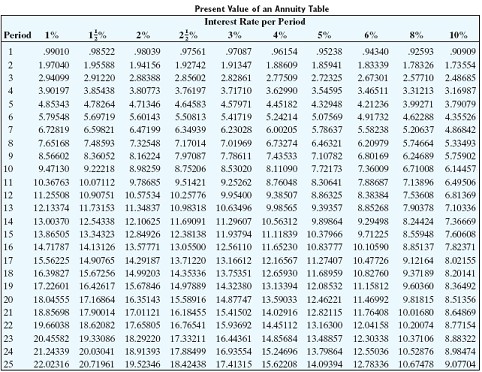 Payments of $3,300 made annually for 25 years at 8% compounded annually
A. $35,226.77 B. $34,744.91 C. $32,765.70 D. $32,381.58
Mathematics
Draw and shade a part of a diagram to represent the figure. of a diagram
A. ![]()
B. ![]()
C. ![]()
D. ![]()
Mathematics
Solve the problem.The sum of a number and its square is 30. Find the number.
A. -5 or -6 B. 5 or 6 C. -5 or 6 D. 5 or -6
Mathematics
Multiply and simplify. ?
? 
A. 
B. 
C. 
D.  y
y
Mathematics