Graph the function f(x) over the given interval. Partition the interval into 4 subintervals of equal length. Then add to your sketch the rectangles associated with the Riemann sum  , using the indicated point in the kth subinterval for ck.f(x) = x2 - 1, [0, 8], left-hand endpoint
A. 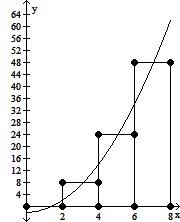
B. 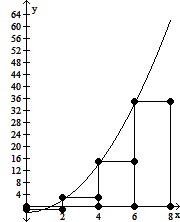
C. 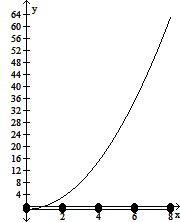
D. 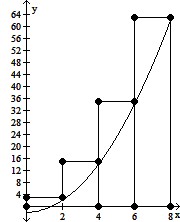
Answer: B
Mathematics
You might also like to view...
Find the amplitude and range of the function.y = -3 sin x
A.  ; [-3, 3]
B. -3; [-3, 3]
C. 3; [-3, 3]
D. 2?; [-3, 3]
Mathematics
Graph the inequality.x - y > -2
A. 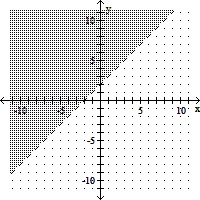
B. 
C. 
D. 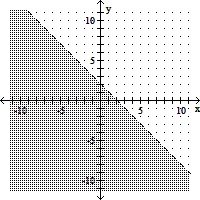
Mathematics
Write the fraction in decimal notation.
A. 1.3 B. 1.4 C. 1.2 D. 1.25
Mathematics
Evaluate the expression for the given values of the variables.(x + 4y)2 for x = 3, and y = 3
A. 15 B. 30 C. 49 D. 225
Mathematics