Give an appropriate answer.The following table shows the average cost of a gallon of tea for the years 2008 through 2012.  Draw a line graph that makes the increase in the price look large.
What will be an ideal response?
Answers may vary. One possible solution: 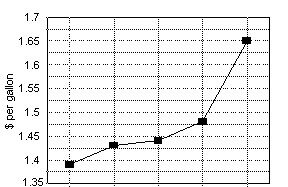
| 2008 | 2009 | 2010 | 2011 | 2012 |
| Year |
You might also like to view...
Use an annual percentage rate table to solve the problem.A restaurant owner purchased a new dishwasher for $4000. She paid 15% down and financed the balance with a  fixed installment loan with an APR of
  Determine the total finance charge and monthly payment for the loan.
A. Total finance charge = $208.80; Monthly payment = $350.73 B. Total finance charge = $167.96 ; Monthly payment = $297.33 C. Total finance charge = $261.46; Monthly payment = $305.12 D. Total finance charge = $158.44; Monthly payment = $296.54
Solve the system.
A. (9, 0)
B. inconsistent (no solution)
C. y = -  + 3, where x is any real number
D. (0, 0)
Simplify the complex fraction.
A. 
B. 
C. 
D. 
Solve the triangle. If there is more than one triangle with the given parts, give both solutions.? = 30.0°a = 7.14b = 14.28
A. No solution B. ? = 90.0°, ? = 60.0°, c = 12.4 C. ? = 60.0°, ? = 60.0°, c = 12.4 D. ? = 60.0°, ? = 90.0°, c = 12.4