Figure 4-10
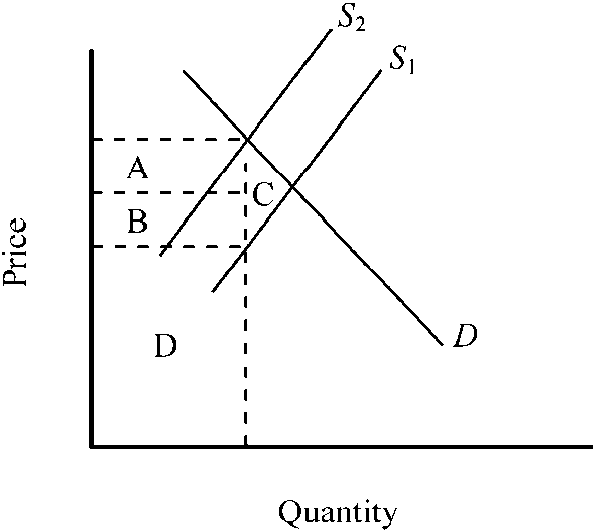
Refer to . The accompanying graph shows the market for a good before and after an excise tax is imposed. The total tax revenue generated is indicated by
a.
area A + area B + area D.
b.
area A + area B + area C.
c.
area A + area B.
d.
area D only.
c
You might also like to view...
If the price elasticity of demand for gasoline equals 0.3, then an increase in the price of a gallon of gasoline from $3.70 to $3.90
A) decreases total revenue. B) increases total revenue. C) leads to no change in total revenue. D) makes the demand for gasoline elastic. E) Both answers B and D are correct.
In the above figure, if the price is $12, a profit-maximizing perfectly competitive firm will have an economic profit
A) of less than $100 but more than $0. B) of more than $100. C) that is negative, that is, it will have an economic loss. D) of zero, that is, it will break even with a normal profit.
Which of the following is NOT an example of a regional trade bloc?
A) the North American Free Trade Agreement B) the European Union C) the Asian-Pacific Trade Agreement D) Mercosur
An increase in the amount of human capital labor... the short-run aggregate supply curve and ... the long-run aggregate supply curve
What will be an ideal response?