Solve the problem.The graph below shows the amount of income tax that a single person must pay on his or her income when claiming the standard deduction. Identify the income levels where discontinuities occur and explain the meaning of the discontinuities.Income Tax, 1000's of dollars 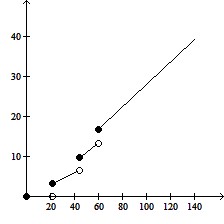 Income, 1000's of dollars
A. Discontinuities at x = $44,000 and x = $60,000. Discontinuities represent tax shelters.
B. Discontinuities at x = $22,000, x = $44,000, and x = $60,000. Discontinuities represent boundaries between tax brackets.
C. Discontinuities at x = $22,000, x = $44,000, and x = $60,000. Discontinuities represent tax cheating on the part of high-income earners.
D. Discontinuities at x = $44,000 and x = $60,000. Discontinuities represent boundaries between tax brackets.
Answer: B
You might also like to view...
Find the volume of the solid generated by revolving the region about the y-axis.The region enclosed by x =  , 0 ? y ?
  , x = 0
A. 8?
B. 
C. 
D. 16?
Factor by grouping.10x2 + 25x + 6x + 15
A. (10x + 3)(x + 5) B. (10x - 3)(x - 5) C. (5x + 3)(2x + 5) D. (5x - 3)(2x - 5)
Add or subtract as indicated.-  +
+ 
A. 
B. 
C. 
D. 
Graph the inequality.y < x + 3
A. 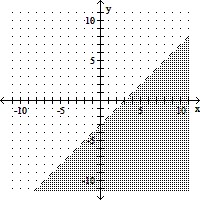
B. 
C. 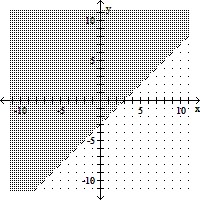
D. 