Use the following graph for a competitive market to answer the question below.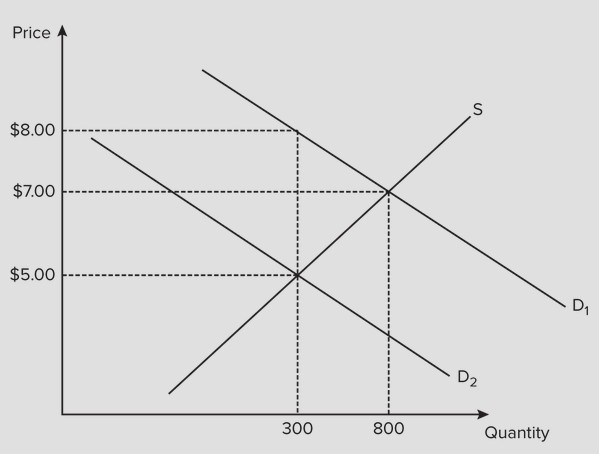 Assume the government imposes a $3 tax on buyers, which results in a shift of the demand curve from D1 to D2. The government's tax revenue is
A. $900.
B. $2,100.
C. $2,400.
D. $600.
Answer: A
You might also like to view...
How do firms estimate the demand for labor?
What will be an ideal response?
A firm’s price is
A. greater than average revenue. B. greater than marginal revenue. C. less than marginal cost. D. equal to average revenue.
A year ago a country reduced the tax rate on all interest income from 40% to 10%. During the year private saving was $600 billion as compared to $500 billion the year before the tax reform. Taxes collected on interest income fell by $150 billion. Assuming no other changes in government revenues or spending which of the following is correct?
a. the substitution effect was larger than the income effect; national saving rose b. the substitution effect was larger than the income effect; national saving fell c. the income effect was larger than the substitution effect; national saving rose d. the income effect was larger than the substitution effect; national saving fell
The following provides data for an economy in a certain year. Consumption expenditures$50Imports$40Government purchases of goods and services$20Construction of new homes and apartments$30Sales of existing homes and apartments$40Exports$50Government payments to retirees$10Household purchases of durable goods$20Beginning-of-year inventory$10End-of-year inventory$20Business fixed investment$30Given the data, compute the value of GDP.
A. $140 B. $160 C. $130 D. $150