In the figure above, the SLF curve is the supply of loanable funds curve and the PSLF curve is the private supply of loanable funds curve. If there is no Ricardo-Barro effect, the figure shows a situation in which the government has a budget
A) deficit of $0.2 trillion.
B) deficit of $1.6 trillion.
C) surplus of $1.4 trillion.
D) surplus of $0.2 trillion.
E) surplus of $1.8 trillion.
D
You might also like to view...
Refer to Figure 28-2. Suppose the economy is at point B in the figure above. Which of the following is true?
A) The economy is producing at potential GDP. B) The expected rate of inflation is 3%. C) The natural rate of unemployment is 3.8%. D) The current unemployment rate is 5%. E) Expected inflation and actual inflation are the same.
What is an example of the bidder's curse?
A) addiction to auctions B) paying less than the auctioned good value C) Bid a value that is higher than the price of the good at a retail store. D) Never win an auction.
The income approach to calculating GDP:
A. is more accurate than using the expenditure approach. B. is less accurate than using the expenditure approach. C. will generate the same answer as using the expenditure approach. D. is simpler to calculate than the expenditure approach.
Exhibit 10-1 Aggregate supply curve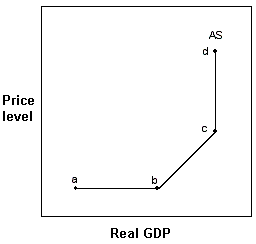 In Exhibit 10-1, higher price levels allow producers to earn higher profits, stimulating production and employment in:
A. the segment labeled ab. B. the segment labeled bc. C. the segment labeled cd. D. both segment bc and segment cd.