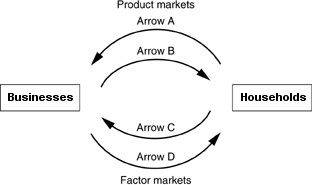
 Refer to the above figure. The top two arrows of the figure refer to the product markets. The bottom arrows refer to the factor markets. Which arrow represents the total monetary value of all goods and services?
A. Arrow A
B. Arrow B
C. Arrow C
D. Arrow D
Answer: A
You might also like to view...
Suppose that the economy is in long-run equilibrium and the government decided to engage in unexpected contractionary policy by decreasing the money supply
If we assume rational expectations, which of the following statements is correct about the effect of contractionary policy in the long run? A) The unemployment rate will decrease, real GDP will decrease and the price level will decrease. B) The unemployment rate will increase, real GDP will increase and the price level will increase. C) The unemployment rate will remain unchanged, real GDP will remain unchanged and the price level will decrease. D) The unemployment rate will remain unchanged, real GDP will remain unchanged and the price level will increase.
Marianne and Laura are both homemakers with children. When Laura starts to work as an unpaid volunteer at a hospital, she hires Marianne to care for her young child. In this context, the gross domestic product (GDP) will _____
a. increase b. decrease c. remain unaffected d. increase if Marianne cares for the child better than Laura e. increase if Laura treats patients with more sincerity than the other volunteers
Suppose that the average equilibrium monthly rental price of apartments and rooms in a college town had been steady at $600, but then the college expanded enrollment from 10,000 to 12,000 . Suddenly there is a shortage of rental housing at the prevailing price of $600 . Which of the following is most likely to be true?
a. The shortage occurred because demand increased, and a new market equilibrium will result in higher rental prices and more rental units available on the market. b. The shortage occurred because supply increased, and a new market equilibrium will result in lower rental prices and fewer rental units available on the market. c. The shortage occurred because demand decreased, and a new market equilibrium will result in lower rental prices and fewer rental units available on the market. d. The shortage occurred because demand increased, and a new market equilibrium will result in higher rental prices and fewer rental units available on the market.
Variables A and B are inversely related. If we plot A on the horizontal axis and B on the vertical axis, the line that connects combinations of A and B in a two-variable diagram is
A) parallel to the horizontal axis. B) downward-sloping (left to right). C) parallel to the vertical axis. D) upward-sloping (left to right). E) a or c