The Lorenz curve shows the:
a. growth of income over time compared to potential growth of income.
b. relative percentage of income going to each of the resources.
c. demand for unskilled versus unskilled labor.
d. actual cumulative percentage of income received compared to a perfectly equal cumulative percentages of income.
d
You might also like to view...
Bobby moves along an indifference curve for shirts and pants by increasing consumption of shirts and decreasing consumption of pants. As Bobby has more and more pants, the number of shirts he is willing to trade for yet another pair of pants
A) decreases. B) increases. C) does not change. D) initially decreases and then increases.
Sheila and Jim live in an island where they are the only two workers. Sheila can either catch 10 fish or gather 40 pounds of berries each day, and Jim can either catch 8 fish or gather 24 pounds of berries each day. Both of them work 200 days per year. At current world prices 1 fish trades for 3.5 pounds of berries. Who has the comparative advantage in producing berries?
A. Sheila B. Sheila and Jim C. Jim D. Neither of them
From the In the News article titled, "Firefighters Watch as Home Burns to the Ground," Which of the following is true?
A. Fire protection is always a public good. B. Fire protection paid for like fire insurance is a private good. C. Fire protection paid for like fire insurance is a public good. D. None of the choices are correct.
The diagram shows two product supply curves. It indicates that:
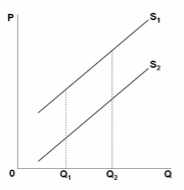
A. over range Q 1 Q 2 price elasticity of supply is greater for S 1 than for S 2 .
B. over range Q 1 Q 2 price elasticity of supply is greater for S 2 than for S 1 .
C. over range Q 1 Q 2 price elasticity of supply is the same for the two curves.
D. not enough information is given to compare price elasticities.