First, create a scatter plot for the data in the table. Then, use the shape of the scatter plot given to determine if the data are best modeled by a linear function, an exponential function, a logarithmic function, or a quadratic function.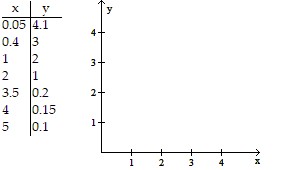
A. 
exponential function
B. 
logarithmic function
C. 
quadratic function
D. 
linear function
Answer: A
You might also like to view...
The following problem involves adjustable-rate mortgage. You the given table if necessary.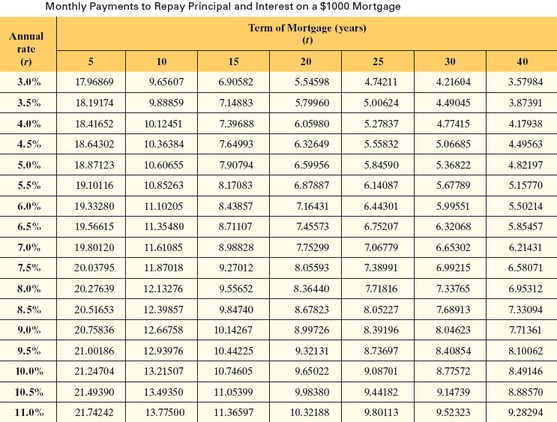 Harry has a 1-year ARM for $75,000 over a 25-year term. The margin is 2%, and the index rate starts out at 2.5% and increases to 3.5% at the first adjustment. The balance of principal at the end of the first year is
  If the monthly payment for the first year is
  how much more will his monthly payment be for the second year?
A. $38.92 B. $42.29 C. $45.31 D. None of the above is correct.
Solve the problem.At age 30, John invested $49,000 in the stock market. By age 35 his investment had grown to $53,000. If the market continues to grow at the same rate, how much will be in his account when John is 39? Round to the nearest dollar.
A. $56,200 B. $53,001 C. $57,000 D. $52,201
Simplify the expression. If necessary, express the result that is not a rational number as a decimal rounded to two decimal places. +
+ 
A. 13
B. 11
C. 85
D. 
Write the function as the composition of two functions f and g such that y = f[g(x)]).y = (x1/2 + 4)3 + 5(x1/2 + 4) 2 - 1
A. f(x) = x1/2 + 4, g(x) = x3 + 5x2 - 1 B. f(x) = x3 + 5x2 - 1, g(x) = x1/2 + 4 C. f(x) = (x + 4)3 + 5x2 - 1, g(x) = x1/2 D. f(x) = (x + 4)3 + 5(x + 4) 2 - 1, g(x) = x1/2 + 4