Refer to the diagrams for two separate product markets. Assume that society's optimal level of output in each market is Q 0 and that government purposely shifts the market supply curve from S to S 1 in diagram (a) on the left and from S to S 2 in
diagram (b) on the right. The shift of the supply curve from S to S 1 in diagram (a) might be caused by a per-unit:
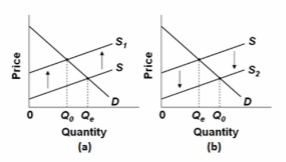
A. subsidy paid to the producers of this product.
B. tax on the producers of this product.
C. subsidy paid to the buyers of this product.
D. tax on the buyers of this product.
B. tax on the producers of this product.
You might also like to view...
A fall in the price of flour, used in making cakes, is likely to:
A) increase the supply of cakes. B) decrease the quantity supplied of cakes. C) increase the quantity supplied of cakes. D) decrease the supply of cakes.
Write an essay on the gains from free international trade
What will be an ideal response?
A rightward shift of the investment demand curve would be caused by a(n):
a. increase in the expected rate of return on investment caused by an increase in business confidence. b. decrease in the expected rate of return on investment caused by a decrease in business confidence. c. increase in the rate of interest. d. decrease in the rate of interest.
Price elasticity of demand is a measure of the change in quantity demanded that results from a change in price
a. True b. False Indicate whether the statement is true or false