Refer to the information provided in Figure 2.4 below to answer the question(s) that follow.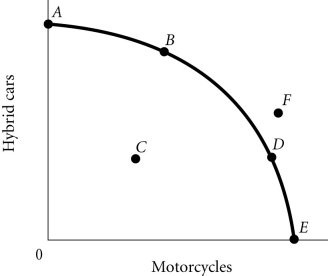 Figure 2.4According to Figure 2.4, the optimal point for the economy is
A. A.
B. B.
C. F.
D. indeterminate from the information given.
Answer: D
You might also like to view...
Higher wages that compensate workers for unpleasant aspects of a job are called compensating differentials
Indicate whether the statement is true or false
The above figure shows a payoff matrix for two firms, A and B, that must choose between a high-price strategy and a low-price strategy. For firm A,
A) setting a low price is the dominant strategy. B) setting a high price is the dominant strategy. C) setting a high price when firm B sets a high price, and setting a low price when firm B sets a low price is the dominant strategy. D) setting a high price when firm B sets a low price, and setting a low price when firm B sets a high price is the dominant strategy.
Economists Cox and Alm compared the gap between rich and poor and found that the richest 20% was about 15 times better off than the poorest 20% when they compared what data?
Assume, in a competitive market, price is initially below the equilibrium level. We predict that price will:
A. decrease, quantity demanded will decrease, and quantity supplied will increase. B. increase, quantity demanded will increase, and quantity supplied will decrease. C. decrease and quantity demanded and quantity supplied will both decrease. D. increase, quantity demanded will decrease, and quantity supplied will increase.