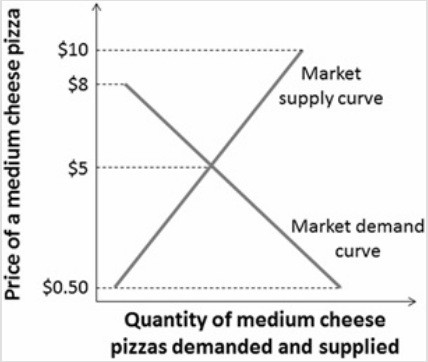
 Refer to the figure. Which of the following is true?
A. At a price of $8, there would be excess demand for pizza.
B. At a price of $5, there would be neither excess demand for nor excess supply of pizza.
C. At a price of $10, there would be neither excess demand for nor excess supply of pizza.
D. At a price of $0.50, there would be excess supply of pizza.
Answer: B
You might also like to view...
Which of the following factors has significantly increased the supply of labor in the United States since 1950?
A) an increase in the number of people who have received college degrees B) an increase in the labor force participation rate of women C) a large increase in the substitution effect as a result of higher wages D) a low birth rate and an aging population
China is a large open economy with an extraordinarily high saving rate
If, as seems likely, there is a decrease in desired saving in the coming years, what effects should we expect to see on China's trade balance (net capital flow), domestic real interest rate, and actual levels of saving and investment?
The federal government began issuing inflation-indexed Treasury bonds in
A) 1913. B) 1989. C) 1997. D) 2001.
Which of the following examples accurately shows the cross-price elasticity of demand?
a. A +3 percent price for rye bread and a +6 percent demand for oatmeal bread equals a cross-price elasticity of demand of +18. b. A +9 percent price for roses and a +11 percent demand for tulips equals a cross-price elasticity of demand of +2. c. A +7 percent price for bar soap and a +21 percent demand for liquid soap equals a cross-price elasticity of demand of +28. d. A +10 percent price for chocolate chip cookies and a +30 percent demand for oatmeal raisin cookies equals a cross-price elasticity of demand of +3.