Solve the problem.The chart below shows the profit-volume graphs of a single-product company for 1995 and 1996. Assume that unit variable costs were identical in both years. How did the fixed costs and unit sales price in 1996 compare with those in 1995?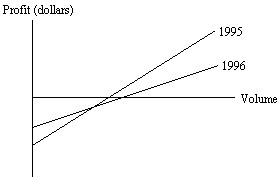
What will be an ideal response?
Fixed cost was higher in 1996 than in 1995, sales unit price was lower in 1996 than 1995.
You might also like to view...
Multiply and simplify. ?
? 
A. 
B. 
C. 
D. 
Provide an appropriate response.In a test of a diet for pigs, the average live weight w (in kilograms) of a pig was a linear function of the number d of days after the start of the diet, where 0 ? d ? 50. The weight of a pig at the beginning of a diet was 25 kg and thereafter the pig gained 5 kg every nine days. (a) Express w as a function of d. (b) Find the weight of a pig 36 days after the beginning of the diet.
What will be an ideal response?
Solve the problem.A firm is considering a new product. The accounting department estimates that the total cost, C(x), of producing x units will be C(x) = 60x + 3,680.The sales department estimates that the revenue, R(x), from selling x units will be R(x) = 70x,but that no more than 485 units can be sold at that price. Find and interpret (R - C)(485).
A. $853 profit, income exceeds cost It is worth it to develop product. B. $66,730 profit, income exceeds cost It is worth it to develop product. C. -$1,170 loss, cost exceeds income It is not worth it to develop product. D. $1,170 profit, income exceeds cost It is worth it to develop product.
Write the expression in the standard form a + bi.( + i)5
+ i)5
A. 16 - 16 i
i
B. 16 - 16i
- 16i
C. -16 + 16i
+ 16i
D. 9 + 5i
+ 5i