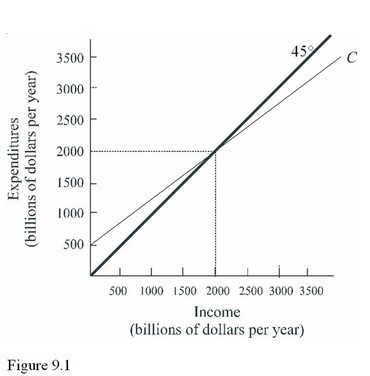
 Using Figure 9.1, the amount of autonomous consumption is
A. $500 billion.
B. Equal to disposable income when the consumption line crosses the 45-degree line.
C. Different at every income level.
D. $750 billion.
Answer: A
You might also like to view...
Which of the following changes will cause a downward movement along the demand curve for reserves?
A) A decrease in deposits held by banks B) A decrease in the federal funds rate C) An increase in deposits held by banks D) An increase in the federal funds rate
?_________ results in slow or absent economic growth.
A. The absence of property rights B. The absence of democracy C. Diminishing returns to labor D. Diminishing returns to capital
If nominal GDP increased from $4 billion to $5 billion while real GDP increased from $3 billion to $4 billion, it follows that:
A. real output rose and price level fell. B. the price level and real output increased at the same rate. C. the price level increased at a faster rate than real output. D. the price level rose by 25 percent.
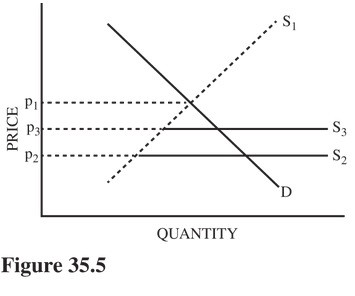 Refer to Figure 35.5. If S1 represents the U.S. domestic supply of a good and S2 represents supply in the United States under conditions of free trade, what does S3 most likely represent?
A. U.S. supply under tariff-restricted trade. B. Production possibilities under conditions of free trade. C. U.S. supply under quota-restricted trade. D. The result of a foreign country dumping this good on the U.S. market.