This graph depicts the demand for a normal good.
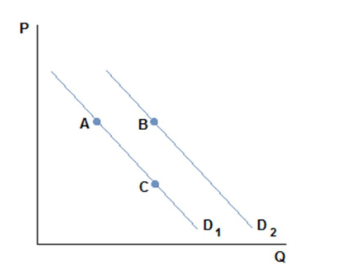
A movement from A to C in the graph shown might be caused by:
A. an increase in price.
B. a decrease in price.
C. an increase in income.
D. a decrease in income.
B. a decrease in price.
You might also like to view...
Each of the following would decrease the demand for U.S. dollars, shifting the demand curve for dollars to the left, except:
A. a decrease in real GDP abroad. B. a decreased preference for U.S.-made goods. C. a decrease in the real interest rate on U.S. assets. D. a depreciation of foreign currencies relative to the U.S. dollar.
Refer to the accompanying figure.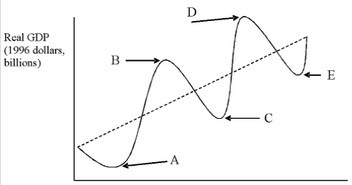 In the figure, a business cycle trough is shown by which point(s)?
A. A only B. A and C and E C. D only D. B and D
Capital, labor, and natural resources combine to produce goods and services. Which of the following will not lead to an increase in the ability of an economy to produce goods and services?
A) increased training for workers B) establishing a more productive technology C) new government restrictions on which technologies may be used to produce goods and services D) discovery of new oil reserves
For developing countries, one of the dangers inherent in the inflows of capital that finance investment is
A. increasing unemployment that accompanies foreign investment. B. rapid outflows of funds that put pressure on exchange rates. C. the deflation that accompanies inflows of foreign capital. D. the inflation that accompanies outflows of foreign capital.