Explain the history of emissions shown in Figures 14.12 and 14.16, explaining how the emissions have changed over this time
What will be an ideal response?
Figures 14.12 detail carbon monoxide, NOx, and SO2 between 1940 and 1998.
Figures 14.16 shows data for NOx, VOCs, and SO2 for 1900 to 2000, and for PM10 for
1940 to 2000.
Apparently NOx, VOCs, and SO2 rose from early in the century through the early 1970s,
then fell (for VOCs and SO2) and leveled off (for NOx,). Carbon monoxide rose from 1940
through around 1972, then fell. PM10 peaked around 1950, then fell steadily,
There was clearly something that happened in the early 1970s that changed the situation for
everything but PM10 . The reason that PM10 declined after 1950 is not so clear to me. The
main point of this question is to call attention to the early 1970s.
That thing that happened at that time was the passage of the Clean Air Act.
You might also like to view...
Consider a small satellite moving in a circular orbit (radius r) about a spherical planet (mass M). The period does not depend upon
A) g at the satellite position. B) the planet mass. C) the satellite mass. D) the radius r. E) the universal gravitational constant.
A metal has a work function of 4.50 eV. Find the maximum kinetic energy of the photoelectrons if light of wavelength 250 nm shines on the metal. (1 eV = 1.60 × 10⁻¹⁹ J, c = 3.00 × 10⁸ m/s, h = 6.626 × 10⁻³⁴ J ? s)
A) 0.00 eV B) 0.37 eV C) 0.47 eV D) 0.53 eV
The diagram below illustrates a portion of the model for the universe described by
Coulomb's Law: Four point charges Q of equal magnitude and sign are arranged on three of the corners of the square of side d as shown in the figure Which one of the arrows shown represents the net force acting on the charge at the upper right hand corner of the square?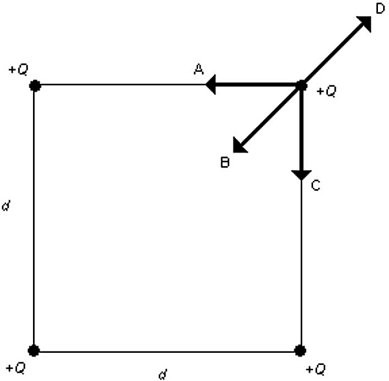
A. A B. B C. C D. D