Refer to the information provided in Figure 3.7 below to answer the following question(s).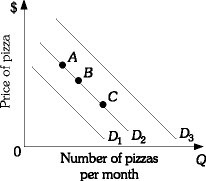 ?Figure 3.7Refer to Figure 3.7. Assume the market is initially at Point B and that pizza is a normal good. An increase in income would cause the market to move from Point B on demand curve D2 to
A. Point C on demand curve D2.
B. demand curve D3.
C. Point A on demand curve D2.
D. demand curve D1.
Answer: B
You might also like to view...
Marginal revenue:
A) is the change in total revenue associated with producing one more unit of output. B) is the product of the price of a good and its quantity sold minus the cost of production. C) is always greater than the total revenue. D) is always equal to the price of the good.
An economy has the income shares information in the table above. Which of the following is TRUE?
A) The information in the table represents the income distribution in the United States. B) Income in the U.S. economy is more equally distributed than that represented in the table. C) Income in the U.S. economy is less equally distributed than that represented in the table. D) The information in the table represents the wealth distribution in the United States.
Economists suggest that a market can fail if
A. consumers have to pay more than they want to. B. the buyer or seller exerts significant power such that they can dictate price. C. producers get smaller profits than they desire. D. governments dictate prices.
In a graph of a firm's short-run total costs and total revenue, the total cost and the total revenue curves, respectively, will intersect the vertical axis
A) above the origin, above the origin. B) above the origin, at the origin. C) at the origin, at the origin. D) below the origin, below the origin.