Of the collection of supply and demand diagrams in Figure 2.2, which one shows the result of an increase in the number of sellers in the market for anything?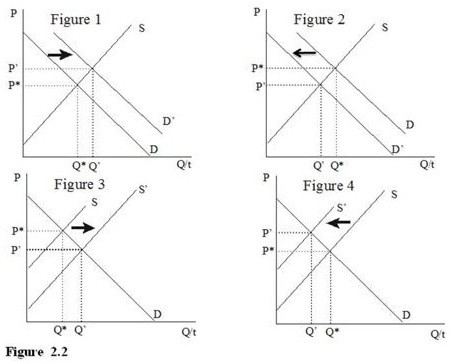
A. Figure 1
B. Figure 2
C. Figure 3
D. Figure 4
Answer: C
Economics
You might also like to view...
Why do people hold money in the classical model?
What will be an ideal response?
Economics
Profit is defined as
a. net revenue minus depreciation. b. total revenue minus total cost. c. average revenue minus average total cost. d. marginal revenue minus marginal cost.
Economics
Which of the following circumstances is most likely to result from a competitive market?
a. Price controls are implemented. b. Existing products are improved. c. Production systems remain stagnant. d. No new products are introduced.
Economics
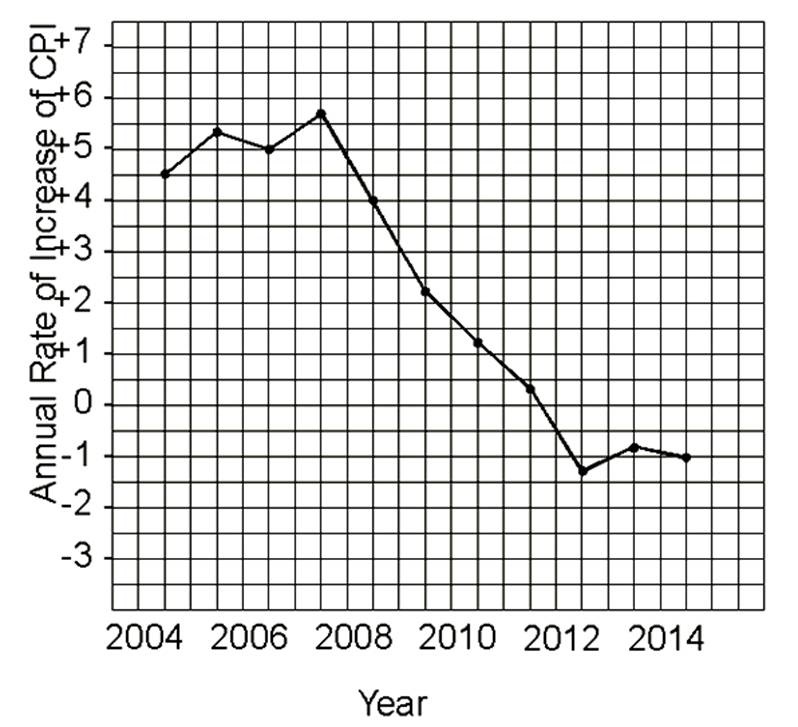
Deflation began in the year _____.
Economics