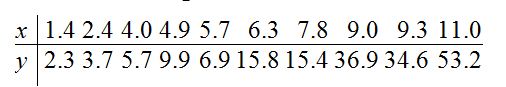
For the following data:
a. Make a scatterplot of y versus x. Is the relationship between x and y approximately linear, or is it nonlinear?
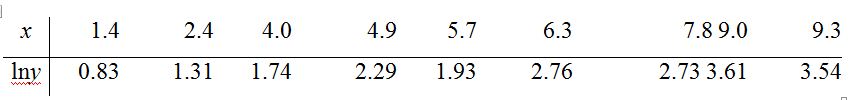
b. Compute the natural logarithm of each y value. This is known as making a log transformation of y.Make a scatterplot of ln y versus x. Is the relationship between x and ln y approximately linear, or is it nonlinear?
c. In general, it is easier to work with quantities that have an approximate linear relationship than with quantities that have a nonlinear relationship. For these data, do you think it would be easier to work with x and y or with x and ln y? Explain.
(a)
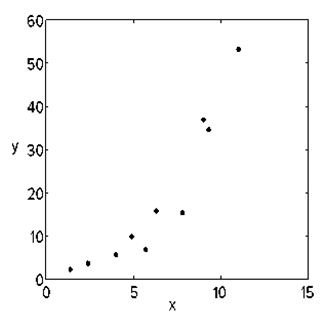
The relationship is non-linear.
(b)
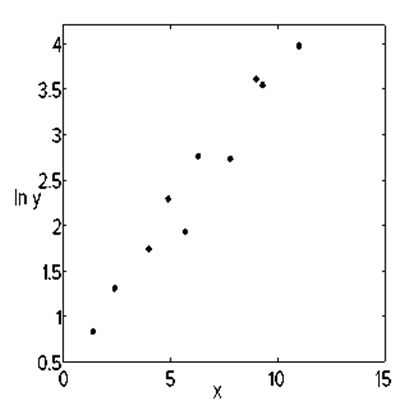
(c) It would be easier to work with x and ln y, because the relationship is approximately linear.
You might also like to view...
Sequence diagrams can be broken into three types: ____, timelines, and step-by-step diagrams.
A. process diagrams B. explanation diagram C. maps D. sidebars
What is the width of the straight flange?
Refer to Drawing Numbers T6592ML R0, T6593ML R0, and T6594ML R0.
Which of the following breeds belongs in the continental Europe category?
a. Brahman c. Angus b. Simmental d. Hereford
In France in 1692–1694, about 15 percent of the population died as a result of what?
a. countrywide rioting that was viciously put down and punished b. a series of devastating fires c. starvation d. diseases from the New World