Refer to the graph shown. Economic output in year 0 is $50 billion. What is potential output in year 2?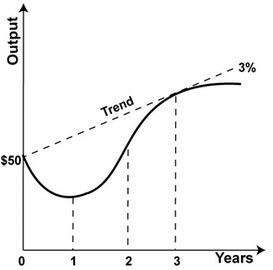
A. $51.5 billion
B. $50 billion
C. $53.0 billion
D. $54.6 billion
Answer: C
You might also like to view...
Which statement is true?
A. All regions of the United States were primarily agricultural in 1865. B. Only the South was primarily agricultural in 1865. C. Only the North and West were primarily agricultural in 1865. D. None of the statements are true.
Over the years, the U.S. economy has become increasingly
A) monopolistic. B) oligopolistic. C) competitive. D) cartelized.
Which of the following statements is true?
a. When central planners set prices above equilibrium for goods and services they create shortages. b. Adam Smith argued that government's role in society would be to do absolutely nothing. c. The United States today comes closer to the socialist form of economic organization than it does capitalism. d. According to Karl Marx, under capitalism, workers would be exploited and would revolt against the owners of capital.
Using Figure 1 above, if the aggregate demand curve shifts from AD2 to AD1 the result in the long run would be: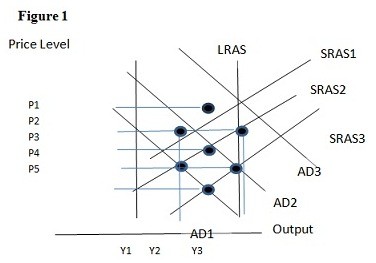
A. P4 and Y1. B. P4 and Y2. C. P5 and Y1. D. P5 and Y2.