The bar graph below shows the recorded high temperatures in Little City for the indicated months. 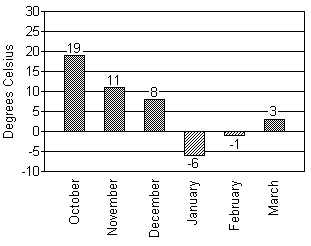 In which month was the recorded temperature the highest?
A. February
B. March
C. January
D. October
Answer: D
You might also like to view...
Evaluate the spherical coordinate integral.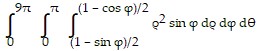
A.  ?(15? - 16)
B.  ?(15? - 16)
C.  ?(15? - 8)
D.  ?(15? - 8)
Fill in the blank.A liter has __________ a quart.
A. greater capacity than B. the same capacity as C. less capacity than
The lists below show five agricultural crops in Alabama, Arkansas, and Louisiana.AlabamaArkansasLouisianasoybeans (s)soybeans (s)soybeans (s) peanuts (p)rice (r)sugarcane (n)corn (c)cotton (t)rice (r)hay (h)hay (h)corn (c)wheat (w)wheat (w)cotton (t)Let U be the smallest possible universal set that includes all of the crops listed; and let A, K, and L be the sets of five crops in Alabama, Arkansas, and Louisiana, respectively. Find the indicated set.L ? K
A. {c, h, n, r, s, t, w} B. {c, n, r, s, t} C. {r, s, t} D. {c, h, n, w}
Provide an appropriate response.When two linear equations are solved for y and the slopes are different and the y-intercepts are different, the lines 
A. Parallel B. One Graph C. Intersecting