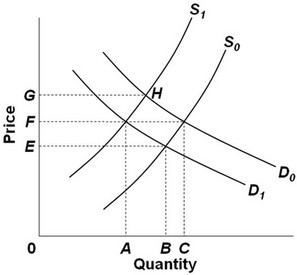
 Refer to the above diagram, which shows demand and supply conditions in the competitive market for product X. Given D0, if the supply curve moved from S0 to S1, then:
A. there has been an increase in the quantity supplied.
B. supply has increased and price has risen to 0G.
C. supply has increased and equilibrium quantity has decreased.
D. supply has decreased and equilibrium quantity has decreased.
Answer: D
You might also like to view...
On the graph above, an example of a positive demand shock is the movement from point ________ to point ________
A) F; G B) H; I C) F; H D) H; F E) none of the above
The Social Security program is like a private pension plan in that _____
a. it is a pay-as-you-go system b. it is voluntary c. benefits are a function of earlier contributions d. you have a legal right to your benefits
If the demand curve facing a monopoly was 1 unit at $7, 2 units at $6, 3 units at $5, 4 units at $4, and 5 units at $3, the marginal revenue from selling the third unit of output:
a. is $5. b. is $4. c. is $3. d. is $1.
An example of a final good would be
A) the soy milk sold to Starbucks. B) the whipped cream sold to Starbucks. C) a soy latte sold by Starbucks to a student. D) the coffee beans sold to Starbucks.