The above graph is
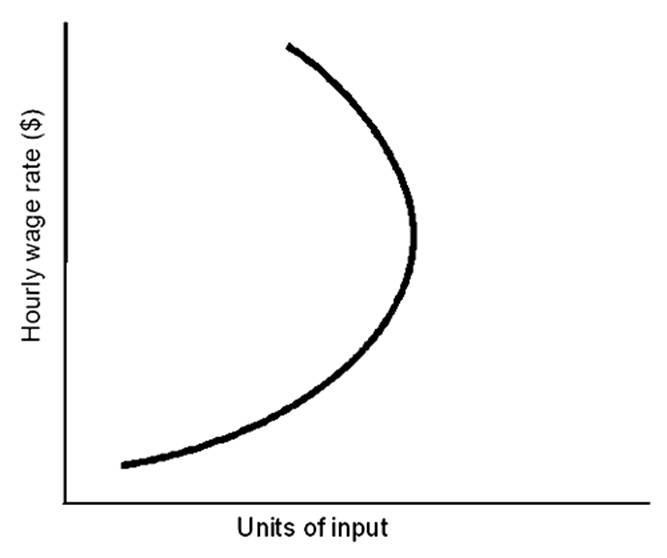
A. the demand for labor.
B. the supply of labor.
C. the supply of capital.
D. the demand for capital.
B. the supply of labor.
You might also like to view...
GDP is a good measure of the distribution of income
Indicate whether the statement is true or false
If your disposable income increases from $30,000 to $35,000 and your consumption increases from $11,000 to $12,000 . your marginal propensity to consume (MPC) is:
a. 0.2. b. 0.4. c. 0.5. d. 0.8. e. 1.0.
If the government wanted a tax to not burden consumers much, it would want to tax an industry with:
a. elastic supply and demand curves. b. inelastic supply and demand curves. c. inelastic supply and elastic demand. d. elastic supply and inelastic demand.
When the price of a good increases, all else equal, the higher price
a. reduces the consumer's set of buying opportunities. b. leads to a parallel shift of the budget constraint. c. will necessarily lead to an increase in the consumption of goods whose price did not change. d. generally discourages the consumption of inferior goods.