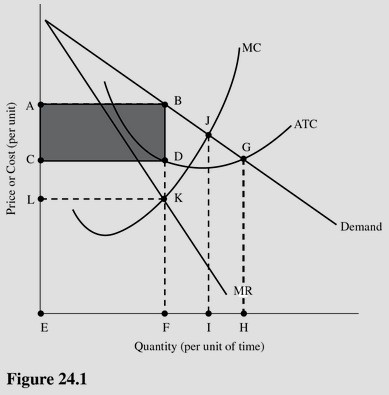
 In Figure 24.1, total profit is represented by the area
A. CDFE.
B. ABGHE.
C. ABFE.
D. ABDC.
Answer: D
You might also like to view...
List the four criteria that are generally used to evaluate economic outcomes
What will be an ideal response?
Refer to Figure 3-1. If the product represented is an inferior good, an increase in income would be represented by a movement from
A) A to B. B) B to A. C) D1 to D2. D) D2 to D1.
The discussion of Figure 2.2 in the text indicates that quantity demanded for most goods tends to increase as income rises. However, the quantity of bananas demanded in the U.S. tends to decrease as income rises
Under this condition, we expect that an increase in consumer income shifts the demand curve for bananas: A) rightward B) no shift. C) leftward. D) upward.
At E1, what is the value of the U.S. dollar?
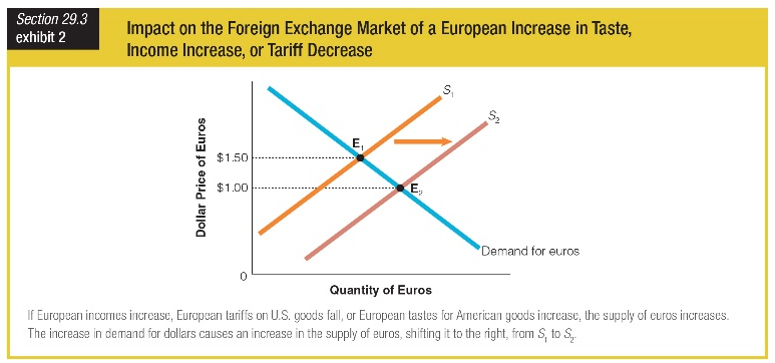
a. less than 1.00 euro
b. 1.00 euro
c. greater than 1.00 euro but less than 1.50 euro
d. 1.50 euro