Solve the problem.The following table shows the number of fires in a county for the years 1994-1998, where 1 represents 1994, 2 represents 1995, and so on.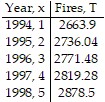 This data can be approximated using the third-degree polynomial T(x) = -0.49x3 + 0.59x2 + 62.80x + 2601.Use the Leading Coefficient Test to determine the end behavior to the right for the graph of T. Will this function be useful in modeling the number of fires over an extended period of time? Explain your answer.
A. The graph of T decreases without bound to the right. This means that as x increases, the values of T will become more and more negative and the function will no longer model the number of fires.
B. The graph of T increases without bound to the right. This means that as x increases, the values of T will become large and positive and, since the values of T will become so large, the function will no longer model the number of fires.
C. The graph of T decreases without bound to the right. Since the number of larceny thefts will eventually decrease, the function T will be useful in modeling the number of fires over an extended period of time.
D. The graph of T approaches zero for large values of x. This means that T will not be useful in modeling the number of fires over an extended period.
Answer: A
You might also like to view...
Find the derivative of y with respect to the independent variable.y = 8
A.  8
8
B. 
C. 8 ln 8
ln 8
D.  8
8
Solve.5(y - 1)2 + 9 = 73
A. 
B. 
C. 
D. 
Factor the polynomial completely, given that the binomial is a factor.x - 1, x3 + 17x2 + 63x - 81
A. (x - 1)(x + 9)(x + 9) B. (x + 1)(x - 9)(x - 9) C. (x - 1)(x2 - 18x + 81) D. (x - 1)(x2 + 81)
The Cross Multiplication Theorem states:_______________
Fill in the blank(s) with the appropriate word(s).