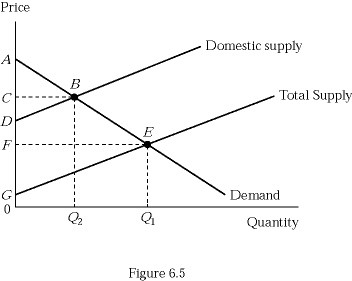
 Figure 6.5 illustrates the market for sugar. If sugar imports were banned, producer surplus in the market would be shown as area:
A. ABC.
B. AEF.
C. CBD.
D. FEG.
Answer: C
You might also like to view...
Suppose the current price of a pound of steak is $6 per pound and the equilibrium price is $9 per pound. What takes place?
A) There is a shortage, so the price rises and quantity demanded increases. B) There is a shortage, so the price falls and quantity demanded increases. C) There is a surplus, so the price falls and quantity demanded increases. D) There is a shortage, so the price falls and quantity demanded decreases. E) There is a shortage, so the price rises and quantity demanded decreases.
A temporary supply shock, such as a bumper crop, would
A) shift the FE line to the right and leave the IS curve unchanged. B) shift the FE line to the left and shift the IS curve up and to the right. C) shift the FE line to the left and leave the IS curve unchanged. D) have no effect on the FE line.
Regulatory capture is where
A) governments take over monopolies through use of regulation. B) firms impose barriers to entry on regulators. C) regulators of an industry look out for the industry instead of society. D) the government taxes the profits of monopolies such that all producer surplus goes to the government.
Cartels are
A. difficult to organize. B. difficult to preserve. C. especially unlikely to succeed if the members sell many varied products. D. All of the responses are correct.