Refer to the information provided in Figure 3.7 below to answer the following question(s).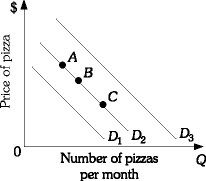 ?Figure 3.7Refer to Figure 3.7. A movement from Point A to Point B on demand curve D2 would be caused by a(n)
A. increase in the price of pizza.
B. decrease in income, assuming pizza is a normal good.
C. decrease in the price of burritos, assuming that pizza and burritos are substitutes.
D. decrease in the price of pizza.
Answer: D
You might also like to view...
For which of the following products is social influence likely to have the greatest impact?
A) school textbook B) restaurants C) high-blood pressure medication D) toothpaste
Is it possible to proactively prevent armed conflict in developing countries?
What will be an ideal response?
Refer to the table below. If the profit for each unit of paper product is $3.00 and the profit for each unit of lumber is $13.50, what is Big Oaks' marginal cost of producing between points B and C on their production possibilities frontier?
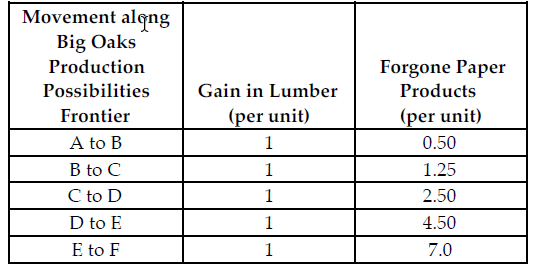
Big Oaks can produce either paper products or lumber with each tree that they harvest. Because Big Oaks can adjust the amount of paper products and lumber they produce from the harvested trees, paper products and lumber are produced in variable proportions. The above table summarizes Big Oaks production possibilities from each harvested tree.
A) $5.75
B) $3.75
C) $1.25
D) $7.50
Empirical work that does not account for differences in the productivity of workers
a. is unlikely to find evidence of wage differentials. b. can provide strong evidence of labor market discrimination. c. is likely to misinterpret apparent evidence of labor market discrimination. d. is accepted as superior to empirical work that does correct for differences in productivity of workers.