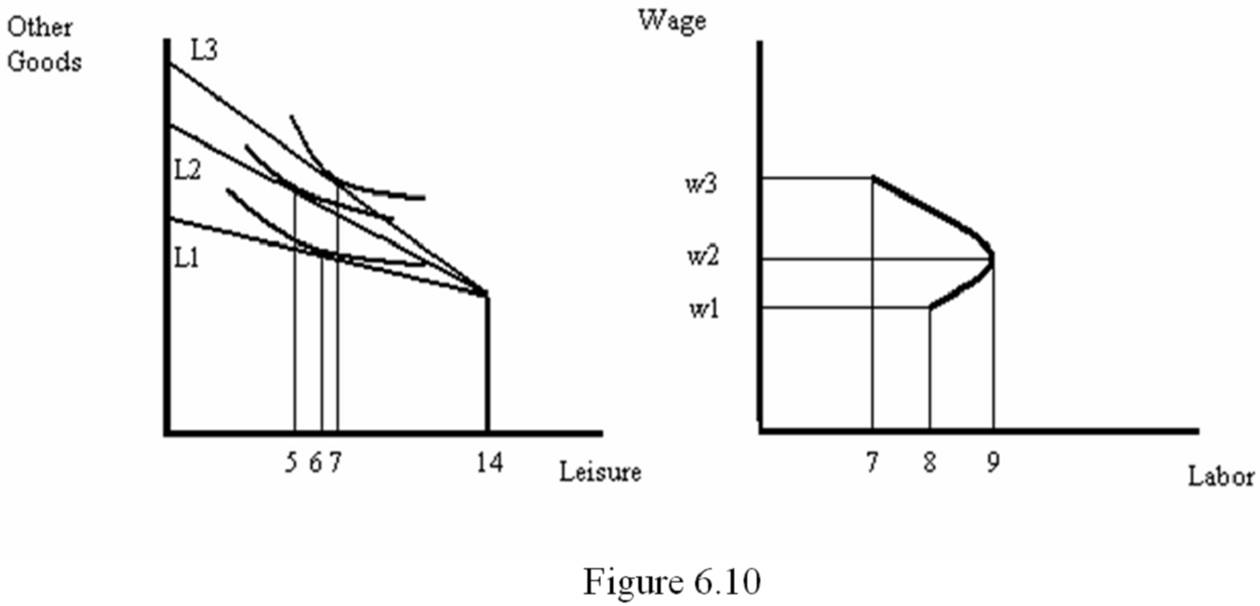
Assume an individual has 14 hours per day for either work or leisure. Using an indifference curve graph, derive an individual's labor supply curve. In your answer, explain what might cause the individual's labor supply curve to eventually bend backwards.
What will be an ideal response?
See Figure 6.10. Suppose the individual's initial wage rate is w1. This is represented by the budget line of L1, the individual chooses 6 hours of labor. That means that they are simultaneously choosing 8 hours of labor. The combination of w1 and 8 hours is plotted as a point on the individual's labor supply curve in the right-hand panel of Figure 6.10. Now suppose that the wage rate increases to w2. This will cause the budget line to rotate to L2. The increase in the wage rate will lead to both a substitution effect and an income effect. As a result of the higher wage, the individual will have an incentive to substitute labor in place of the relatively more expensive leisure. However, the higher income will provide the individual with an incentive to work fewer hours. In the figure, the substitution effect dominates the income effect and the individual chooses to work 9 hours. Thus, the supply curve is upward-sloping. Now suppose the wage rate increases to w3, causing the budget line to rotate to L3. Here, the income effect dominates the substitution effect, causing the individual to work only 7 hours. As a result, the labor supply curve is backward-bending.
You might also like to view...
A changes in which of the following shifts the demand curve for hamburgers?
A) an increase in the price of the meat used to produce hamburgers B) an increase in the price of a hamburger C) a fall in the price of french fries, a complement for hamburgers D) an increase in the number of hamburger restaurants
If a macroeconomist aggregates many markets into one, then
a. individual market differences are eliminated. b. one must not confuse ravioli and hot dogs. c. she is performing a meaningless exercise. d. differences between products must still be noted.
Graphically illustrate and explain the effects of an increase in the saving rate on the Solow growth model. In your answer, you must clearly label all curves and the initial and final equilibria. In your answer, explain what happens to the rate of growth of output per worker and the rate of growth of output as the economy adjusts to this increase in the saving rate
What will be an ideal response?
A major difference between a monopolist and a perfectly competitive firm is that
A. the monopolist charges the highest possible price that he can. B. the monopolist's marginal revenue curve lies below its demand curve. C. the monopolist is certain to earn economic profits. D. the monopolist engages in marginal cost pricing.