Use your graphing calculator to convert to rectangular coordinates. Round all values to four significant digits.
?

What will be an ideal response?

You might also like to view...
Find the equation of the line of best fit from the data in the table. Round the slope and the y-intercept to the nearest hundredth.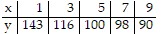
A. y = -6.2x + 140.4 B. y = -6.8x + 150.7 C. y = 6.8x - 150.7 D. y = 6.2x - 140.4
Graph the inequality.y ? - 5x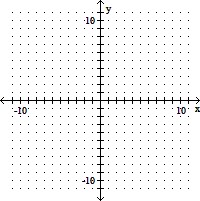
A. 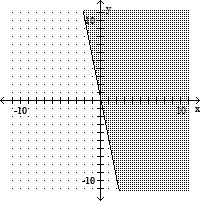
B. 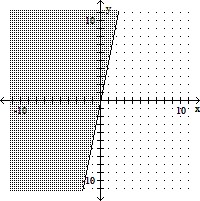
C. 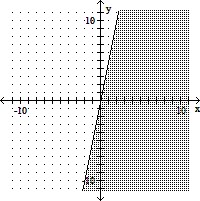
D. 
Solve the problem.The function f(t) = -0.12t2 + 0.53t + 30.8 models the U.S. population in millions, ages 65 and older, where t represents years after 1990. The function g(t) = 0.55t2 + 11.89t + 105.3 models the total yearly cost of Medicare in billions of dollars, where t represents years after 1990. What does the function  represent? Find
  (15).
(15).
A. Cost per person in thousands of dollars. $0.16 thousand B. Cost per person in thousands of dollars. $0.03 thousand C. Cost per person in thousands of dollars. $34.67 thousand D. Cost per person in thousands of dollars. $8.64 thousand
Solve.x4 - 12x2 + 27 = 0
A. ±3, ±3
B. 3, 
C. ±3, ±
D. ±3, ±2