Solve the problem.Suppose that the speed of a car, measured in miles per hour (mph), is monitored for some short period of time after the driver applies the brakes. The following table relates the speed of the car to the amount of time, measured in seconds (sec), elapsed from the moment that the brakes are applied.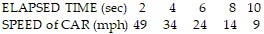 Represent the data in the table graphically with elapsed time on the horizontal axis and speed on the vertical axis. What general trend do the data reflect?
What will be an ideal response?
With increasing elapsed time, the speed decreases.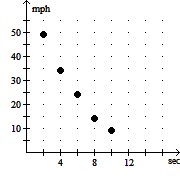
You might also like to view...
Solve the problem.Find the value of a retirement savings account paying an APR of 6.6% (compounded monthly) after 40 years of monthly contributions (contributions made at the end of each month, including the last month) when the monthly contribution is $70. Round your answer to the nearest cent.
A. $153,058.18 B. $151,340.60 C. $164,337.15 D. $168,962.63 E. $176,383.48
Prepare a probability distribution for the experiment. Let x represent the random variable, and let P represent the probability.Three coins are tossed, and the number of heads is noted.
A. 
B. 
C. 
D. 
Solve. Write the fraction in simplest form.Of the fifty states in the United States, 12 have at least one mountain higher than 12,000 feet. What fraction of states have at least one mountain higher than 12,000 feet?
A. 
B. 
C. 
D. 
Find the solution set for the equation.|r - 1| = 7
A. {-8} B. {-6, 8} C. {6, 8} D. ?