Use Table 1.1 to graph the data appropriately. What can you CONCLUDE based on the new figure?
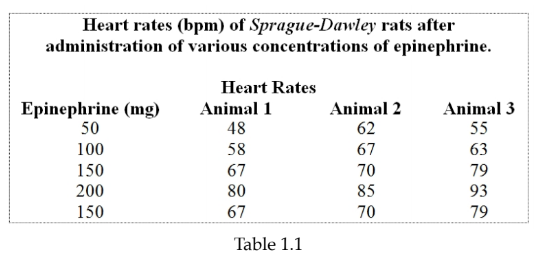
Graphs should address the errors in Figure 1.1.
This small sample suggests that an increase in epinephrine concentration increases the average heart rate of
Sprague-Dawley rats.
You might also like to view...
Interneurons connect:
a. efferent neurons to motor neurons b. afferent neurons to sensory neurons c. central neurons to afferent neurons d. none of the above
Which of the following events occurs when erythrocytes are destroyed?
A. Urine output increases. B. Bile is manufactured by the gallbladder. C. Heme is transported by transferrin to the liver. D. The globin portion of the molecule is broken down into amino acids. E. Iron is secreted into the bile.
What is the correct order of the branches off the aortic arch from right to left?
A. Brachiocephalic trunk, right common carotid artery, left common carotid artery B. Brachiocephalic trunk, left subclavian artery, left common carotid artery C. Brachiocephalic trunk, right common carotid artery, left subclavian artery D. Right subclavian artery, brachiocephalic trunk, left common carotid artery E. Brachiocephalic trunk, left common carotid artery, left subclavian artery
Ribose and deoxyribose are carbohydrates.
Answer the following statement true (T) or false (F)