The graph below shows the approximate annual percentage growth rate in world population for the years 1960 through 2010. Data is estimated by the UN Census Bureau.Annual Growth Rate (Percentage)  Use the graph to answer the question.Describe the trend in world population during the period 1976-1978
A. It remains constant
B. It increases at a steady rate
C. It increases at a faster and faster rate
D. It decreases at a steady rate
Answer: B
Mathematics
You might also like to view...
Make a sketch of the population function (as a function of time) that results from the given growth rate function. Assume the population at time t = 0 begins at some positive value.
A. 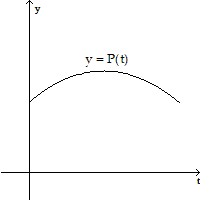
B. 
C. 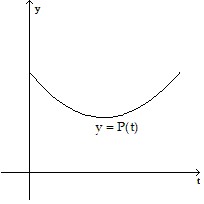
D. 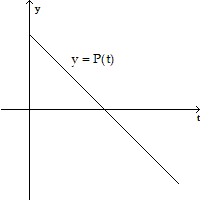
Mathematics
Determine the number of terms in the expression.x + y
A. 1 B. 0 C. 3 D. 2
Mathematics
Use the graph and the factor theorem to list the factors of f(x).y = f(x)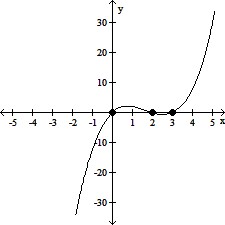
A. x, (x - 2), (x + 3) B. (x + 2), (x - 3) C. x, (x - 2), (x - 3) D. (x + 2), (x + 3)
Mathematics
Solve the equation for the specified variable.c =  for t
for t
A. t =  or t =
B. t =  or t =
C. t =  or t =
D. t =  or t =
Mathematics