Determine whether the graph is that of a function. If it is, use the graph to find its domain and range, the intercepts, if any, and any symmetry with respect to the x-axis, the y-axis, or the origin.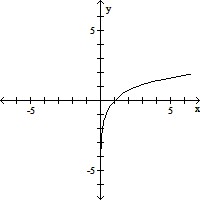
A. function
domain: {x|x > 0}
range: all real numbers
intercept: (1, 0)
symmetry: none
B. function
domain: all real numbers
range: {y|y > 0}
intercept: (1, 0)
symmetry: none
C. function
domain: {x|x > 0}
range: all real numbers
intercept: (0, 1)
symmetry: origin
D. not a function
Answer: A
You might also like to view...
Find the quadratic approximation of f at x = 0.f(x) = x
A. Q(x) = 81x2 B. Q(x) = 9x C. Q(x) = 1 + 9x D. Q(x) = 1 - 9x
Solve the problem.The tread life of a particular brand of tire is a random variable described by a normal distribution with a mean of 60,000 miles and a standard deviation of 2300 miles. What is the probability a particular tire of this brand will last more than 57,700 miles? Express the probability as a decimal.
A. 0.16 B. 0.84 C. 0.975 D. 0.68
Solve.The population of a city has varied considerably in recent years. The data in the table relates the population P to time t, in years. Use a quadratic function fitted to the data to predict the population in year 10. 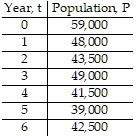
A. 58,964 B. 119,000 C. 48,431 D. 81,020
Evaluate the expression.(53)
A. 20 B. 5 C. 10 D. 1