Graph the function f(x) over the given interval. Partition the interval into 4 subintervals of equal length. Then add to your sketch the rectangles associated with the Riemann sum  , using the indicated point in the kth subinterval for ck.f(x) = cos x + 3, [0, 2?], left-hand endpoint
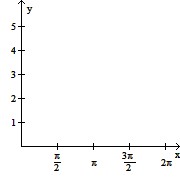
A. 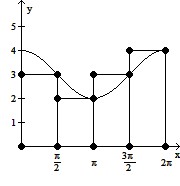
B. 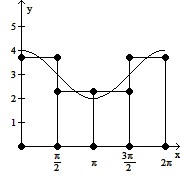
C. 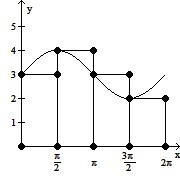
D. 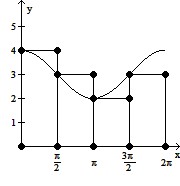
Answer: D
Mathematics
You might also like to view...
The figure shows the percentage of the U.S. population, f(x), made up of teachersas a function of time, x, where x is the number of years after 1900. Use the graph to solve the problem.  In which year did the percentage of teachers in the U.S. reach a minimum?
A. 2000 B. 1900 C. 1970 D. 1990
Mathematics
Use the distributive property to simplify. (9x2 - 9x + 6)
A. 6x2 - 18x + 12 B. 6x2 + 6x - 4 C. 6x2 - 6x + 4 D. 6x2 - 9x + 6
Mathematics
Tell whether the pair of ratios forms a proportion.
?
 ,
,  ?
?
A. yes B. no
Mathematics
Subtract.-10.6 - 14.1
A. -24.7 B. 24.7 C. -3.5 D. 3.5
Mathematics