What does the graph point at the intersection of $2 per pound and 3,000 pounds of coffee show?
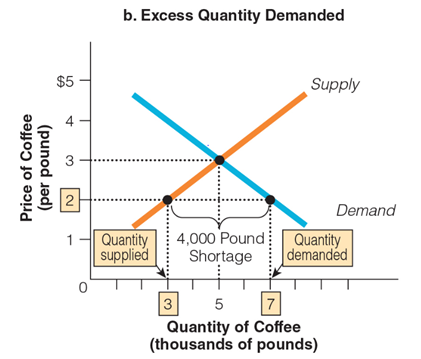
a. an equilibrium point
b. a shortage of quantity supplied
c. a deficit of quantity demanded
d. a surplus of quantity supplied
b. a shortage of quantity supplied
You might also like to view...
A change in the price of a good ________ its supply curve and ________ a movement along its supply curve
A) does not shift; causes B) shifts; does not cause C) does not shift; does not cause D) shifts; causes E) None of the above because the change in the price might cause either a shift in the supply curve or a movement along the supply curve depending on the size of the change.
Refer to Figure 20-1. Based on the graph of the labor market above, if a minimum wage of $8 per hour is imposed, which of the following will result?
A) The quantity of labor demanded by firms will rise. B) The quantity of labor demanded by firms will fall. C) The unemployment rate will fall. D) Both A and C will occur.
the highest raking officer of a corporation
What will be an ideal response?
Refer to the information provided in Figure 7.8 below to answer the question(s) that follow. 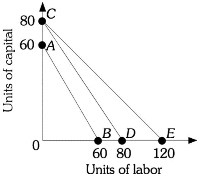 Figure 7.8Refer to Figure 7.8. The firm's isocost line could shift from CD to CE if the
A. firm's total expenditures increased by 50% or the price of capital and labor each decreased by 33%. B. price of labor decreased by 50%. C. firm's total expenditures increased by 50%. D. price of labor increased.