Figure36-9
?
?
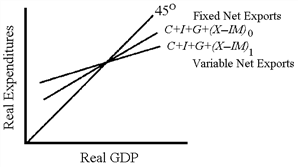
In Figure 36-9, the C + I + G + (X? IM)1 line is flatter than the C + I + G + (X? IM)0 line because the
A. (X? IM)1 line indicates that net exports decline as GDP rises.
B. (X? IM)1 line indicates that net exports rise as GDP rises.
C. multiplier is greater for the (X? IM)1 line.
D. (X? IM)1 line indicates that tariffs, quotas, and other trade barriers are keeping net exports below their full potential.
Answer: A
You might also like to view...
According to your text, which group of scientists are completely free from biases?
A) Physicists B) Biologists C) Economists D) All of the above. E) None of the above.
Macroeconomic equilibrium is always good, because:
a. Actually, macroeconomic equilibrium can be either good or bad. It is not always good. b. Because it is the only place where actual demand equals actual supply. c. Because it is the only place where planned demand equals planned supply. d. None of the above. e. It gives the nation a breather and allows it to catch up with itself economically.
Which of the following would increase labor productivity, ceteris paribus?
A. A decrease in the quantity of capital. B. An increase in the number of participants in the labor force. C. An increase in the quality of capital. D. Crowding out.
Use the following information to answer this question. If nominal GDP rises from $100 trillion to $120 trillion, while the GDP deflator rises from 2.0 to 2.2, the percentage change in real GDP is approximately equal to
A) -10%. B) 10%. C) 20%. D) 9.1%. E) 0%.