Solve.The data set represents a month-to-month progression of gasoline prices over the course of several months in an unspecified city. Use a graphing calculator to determine the quadratic regression equation for this data set. 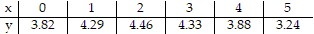
A. y = 0.143x2 + 0.596x + 3.829
B. y = -0.143x2 + 0.595x + 3.830
C. y = 0.143x2 - 0.595x + 3.830
D. y = -0.143x2 + 0.595x - 3.829
Answer: B
Mathematics
You might also like to view...
Solve the problem.The curve x = y2 is revolved about the x-axis. Find a parametrization of the surface of revolution and then find the equation of the tangent plane at the point 
What will be an ideal response?
Mathematics
Find a formula for a n for the arithmetic sequence if a 1 = 4 and d = 7.
a. a n = –7n + 11 b. a n = 7n – 3 c. a n = 7n + 3 d. a n = –7n + 3
Mathematics
Differentiate.
Mathematics
Factor completely.
What will be an ideal response?
Mathematics