Solve the problem.After reviewing a movie, 1000 people rated the movie as excellent, good, or fair. The following data give the rating distribution. Draw a pie chart to represent the data.ExcellentGoodFair200?500?300
A. 
B. 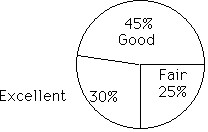
Answer: A
You might also like to view...
Solve.On a recent trip, Asha drove 256 miles on 10 gallons of gasoline. How many miles per gallon did she average?
A. 2624 miles per gallon
B. 640 miles per gallon
C.  miles per gallon
D. 24 miles per gallon
Find the mean.9, 9.2, 7.4, 9.2, 7.2
A. 8.4 B. 9.2 C. 9 D. 7
Find the perimeter of the figure.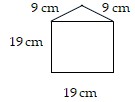
A. 56 cm B. 94 cm C. 379 cm D. 75 cm
Use your graphing calculator to graph the function between alt="" class="wirisformula" data-wiris-created="true" src="https://sciemce.com/media/3/ppg__cognero__Section_4.6_Graphing_Combinations_of_Functions__media__ba8705dd-f38f-410d-a342-d147bdb678f9.PNG" style="vertical-align:middle;" />, and ? ? ? ? and
and  . Show the graph of
  ,
,  . (Make sure your calculator is set to radian mode.)
?

?
A. ?
B. ?
C. ?
D. ?
E. ?