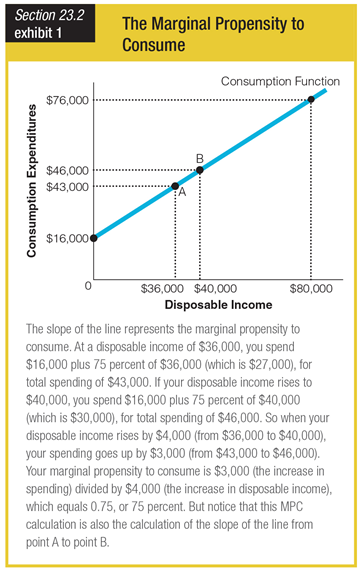
Imagine that this chart is redrawn to represent the marginal propensity to consume of the economy as a whole. How would the chart differ?
a. The slope would be negative.
b. The scale would be larger.
c. The graph would be renamed “Aggregate Expenditure.”
d. The label on the vertical axis would be renamed “Aggregate Expenditure.”
b. The scale would be larger.
You might also like to view...
Rationing occurs for goods
A) that have a positive price. B) that have a zero price. C) that have a negative price. D) that are not manufactured.
Nominal gross domestic product (GDP) is measured in terms of the _____
a. current-year prices b. base-year prices c. export of goods and services d. amount of taxes collected e. hours of employment
The math and graphics used in economics help us better understand the logic of:
a. verbal reasoning. b. rational choice. c. hypothesis testing. d. business forecasting.
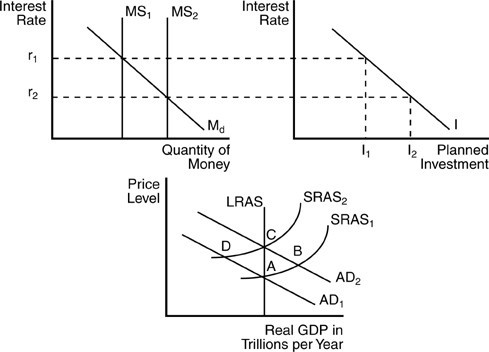 In the above figure, suppose the economy is at a short-run equilibrium at point B and the interest rate is r2. Which of the following policy options for the Fed will help solve the short-run situation?
A. open market sale of government securities B. open market purchase of government securities C. lowering the required reserve ratio D. lowering the differential between the discount rate and the federal funds rate