Exhibit 3-8 Demand and Supply Data for Video Games
?
Price
Quantity Demanded
of Video Games
Quantity Supplied
of Video Games
$75
400
900
70
450
850
65
500
800
60
550
750
55
600
700
50
650
650
45
700
600
40
750
550
?
In Exhibit 3-8, at any market price of video games above $50, a(n) ______________ would result, causing price to __________.
A. excess demand; rise
B. excess supply; rise
C. excess demand; fall
D. excess supply; fall
Answer: D
You might also like to view...
Janet calculated the GDP growth rates for France between 2012 and 2013. Using 2012 prices for both years, GDP increased 5 percent. Using 2013 prices for both years, GDP increased 1 percent
Hence the chained-price method will calculate that between these years, real GDP increased by A) 3 percent. B) 4 percent. C) 1 percent. D) 5 percent. E) 6 percent.
The optimal level of military expenditures is the level at which _____
a. a country is completely protected from foreign invasion b. a country spends more on national defense than all other countries along it to win an arms race c. a country spends more on national than its rivals d. the marginal benefit of additional expenditures equals marginal cost
When two variables move in opposite directions, the curve relating them is upward sloping, and we say the variables are positively related
a. True b. False Indicate whether the statement is true or false
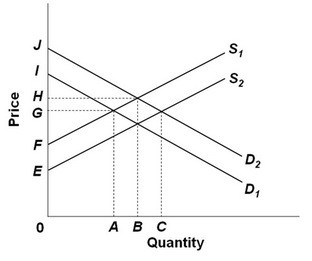 Refer to the above supply and demand graph. Point A represents the current equilibrium level of output of this product and point B represents the optimal level of output from society's perspective. If government decides to correct this externality with a subsidy to consumers, then the:
A. demand curve will shift from D2 to D1. B. demand curve will shift from D1 to D2. C. supply curve will shift from S1 to S2. D. supply curve will shift from S2 to S1.